About the Victorian Food and Fibre Export Performance Report
For more than a decade, the Victorian Food and Fibre Export Performance Report has been an annual publication. It serves as a key reference document for industry and government, focusing on the export performance of agricultural commodities and food products.
The export data is used by industry to understand market trends and emerging issues, and by the Victorian Government to guide policy and program development work.
The Victorian Food and Fibre Export Performance Report is presented across two parts:
- A Summary Report highlighting Victoria’s food and fibre export performance in the 2024-25 financial year.
- A Data and Analysis Report comprising five years of data to 2024-25 on Victoria’s industry and regional export performance to ensure continuity with the historical data provided from previous Food and Fibre Export Performance reports.
How is the data presented?
The 2024-25 Victorian food and fibre export data is presented in a format to highlight Victoria’s food and fibre export outcomes and is aggregated by state of origin as opposed to state of loading.
State of origin is based on statistics compiled by the Australian Bureau of Statistics (ABS) to identify the Australian State in which the final stage of production or manufacture occurred (ABS 5489.0 - International Merchandise Trade, Australia, Concepts, Sources and Methods).
Volumes throughout the report are shown in gross weight (‘000 tonnes). Unless otherwise specified, dollar values quoted in this report have been rounded to the nearest million, or to the nearest single decimal place where expressed in billions. Dollar values are nominal.
Figures in the product category tables have also been rounded, resulting in some total Victoria values being slightly different to the aggregate product and item totals in each table.
Accessible version
Read an accessible version of the Victorian Food and Fibre Export Performance Report 2024-25.
Victoria's food and fibre export performance highlights 2024-25
In 2024‑25 Victoria has maintained its position as Australia’s largest food and fibre exporter by value, accounting for 28% of the national total. Victorian food and fibre exports increased 10% on 2023-24 to $22.1 billion in value, surpassing our 2030 target for a second straight year.
Top markets for select Victorian food and fibre products 2024‑25

Victoria’s market share of key food and fibre exports by value
 Grains 🌾 $4.5b — third highest year on record, despite a drier than normal season
Wine 🍷 $186m — rebounding strongly on the back of China's lifted tariffs and global demand for premium varietals ↑ 23% YoY
Prepared foods & beverages 🛒 $1.4b — driven by a shift to higher-value premium products
Dairy 🥛 $2.8b — 74% of national share, up 12% in value despite drought, reduced herd numbers and supply chain pressures
Market share of top 5 markets in 2019 and 2024-25
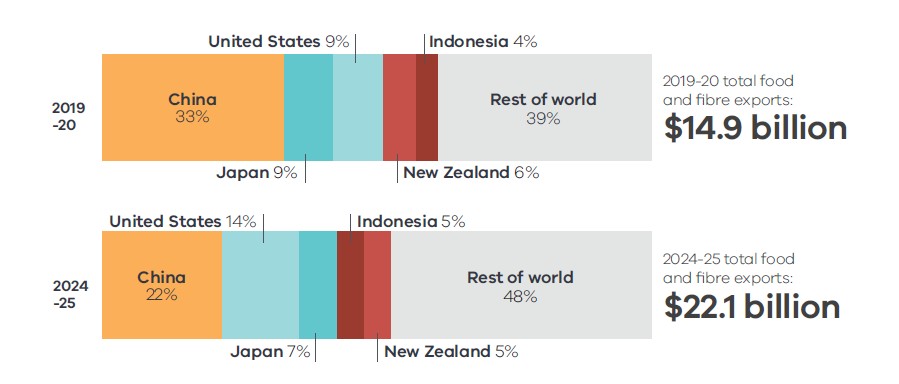
Over the past 5 years, Victoria’s export concentration has declined markedly.
In 2024-25, the top 5 agrifood markets accounted for 52% of total export value, down from 61% in 2019-20. Over the same period, the rest of the world increased its share from 39% to 48%, demonstrating robust growth across a diverse set of markets.
China remains Victoria’s top export market, with food and fibre exports worth $4.8b and taking the highest share of any market in 2024-25. However, exporters are becoming less reliant on the Chinese market, with its share of exports falling from 33% to 22% over the last 5 years.
Top 6 Victorian exports
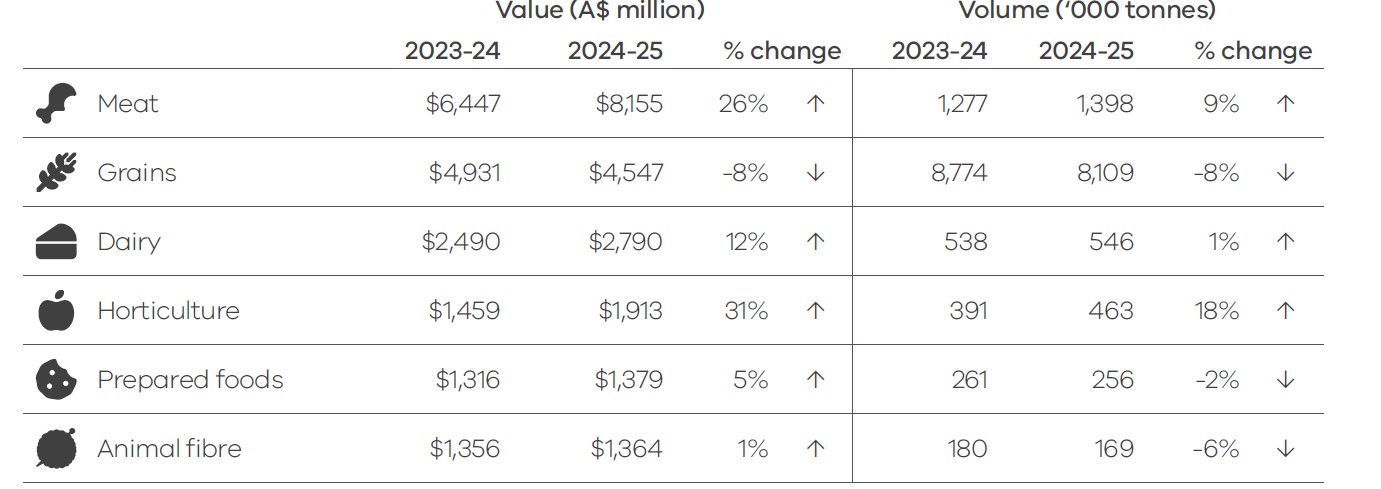
Meat remains Victoria’s largest agrifood export, reaching $8.2b, underpinned by strong performance in beef and sheep meat. Victoria is the second largest meat exporter in Australia, increasing its total national market share from 29% to 30% in 2024-25.
Victoria recorded its strongest year on record for horticulture exports, valued at $1.9b and comprising 45% of Australia’s total horticulture export value. Growth was driven primarily by almonds and fruit, with Victoria producing around half of Australia’s almonds.